How We Built a Firm-Specific Memory Layer for Secondaries Investors
Feb 19, 2026

The Problem: No Two GPs Speak the Same Language
Secondaries investors occupy one of the most operationally complex seats in private markets. A mid-sized secondaries fund managing 40–80 LP positions must synthesize quarterly data from dozens of GPs, each of whom formats, labels, and reports performance metrics in an entirely idiosyncratic way.
Consider the simple question: what is the current NAV of Fund X? The answer lives somewhere in a quarterly report — but that report might label the relevant figure as Net Asset Value, Fair Value of Investments, Partners Capital, Total Fund Value, or simply NAV (unaudited). The table might be on page 3 or page 22. It might be denominated in USD, EUR, or GBP. It might be presented gross or net of fees. It might be rolled into a portfolio-level table that requires summing sub-line items.
Multiply this ambiguity across 60 GPs, four vintages, and eight years of quarterly reports — and you understand why the typical secondaries operations team spends multiple days per quarter manually transcribing numbers into Excel fund models before anyone can do any actual analysis.
The fundamental challenge is not data extraction — it is schema heterogeneity. Each GP has implicitly defined their own reporting schema, and that schema is never documented.
Generic AI tools fail here for a well-understood reason: they treat every document as a new problem, with no memory of how a given GP has structured their reports historically. This is the core architectural limitation of standard Retrieval-Augmented Generation (RAG) systems, which were designed for broad knowledge retrieval, not the firm-specific, schema-aware extraction that institutional workflows require.

What Is a Memory Layer — and Why Does It Matter?
A memory layer is a persistent, firm-owned knowledge base that sits upstream of the extraction pipeline. Unlike a standard LLM context window — which is stateless and resets after each session — a memory layer accumulates structured knowledge about how a firm's GPs report, how fields map to a firm's internal schema, and what edge cases or exceptions have been encountered in prior documents.
The concept draws on recent advances in "in-context learning" and episodic memory in AI systems, where a model's effective capability is dramatically enhanced not by retraining but by augmenting its working context with relevant, task-specific prior knowledge.
Category | What It Stores | Example |
|---|---|---|
GP Schema Map | Where each GP places key fields, what they call them, and how they structure their tables | "Advent International Q3 reports label NAV as 'Total Partners' Capital' in Note 6, Table 3, net of management fees" |
Normalization Rules | Currency conventions, fiscal year definitions, gross vs. net distinctions, sign conventions for capital calls | "This GP reports distributions as negative values; invert sign on extraction" |
Reconciliation Anchors | Quarter-over-quarter validation checks, expected roll-forward relationships between metrics | "Prior NAV + Capital Called – Distributions + Unrealized Gain = Current NAV; flag deviations > 1%" |
Critically, this knowledge compounds. When the system encounters a new quarterly report from a GP it has seen before, it does not re-learn that GP's schema from scratch — it retrieves the prior schema map, validates it against the new document's structure, updates any changes, and extracts with high confidence. This is the architectural difference between a generic AI tool and a firm-tuned system.
Atlas: Agentic Extraction With a Persistent Memory Layer
Clarus's extraction engine — Atlas — is built around an agentic architecture rather than a traditional RAG pipeline. The distinction matters enormously for financial document extraction.
In a standard RAG system, a query triggers a semantic similarity search that retrieves document chunks, which are then passed to a language model for synthesis. This works reasonably well for broad knowledge retrieval. It works poorly for structured financial data extraction, where the challenge is not finding "relevant" content but precisely locating, interpreting, and mapping specific numerical fields within complex, hierarchical document structures.
Atlas instead operates as an investigative agent. When ingesting a new GP quarterly report, it follows a structured reasoning loop:
Step 1: List & orient — survey the document's table of contents, section headers, and page structure to build a navigational map before extracting anything.
Step 2: Entity recognition — identify the fund name, reporting period, currency, and any portfolio company names referenced, cross-checking against the memory layer's entity registry.
Step 3: Schema retrieval — query the memory layer: has this GP reported before? If yes, retrieve the prior schema map. If no, initiate schema discovery mode.
Step 4: Targeted extraction — navigate directly to the known locations of key fields (or, in schema discovery mode, search systematically), extracting values with source provenance (page number, table, row, column).
Step 5: Validation — run reconciliation checks against prior-period values and internal consistency rules stored in the memory layer.
Step 6: Memory update — persist any new schema observations, exception cases, or corrections to the memory layer for future use.
The agent isn't retrieving — it's investigating. It reasons about where information should be before it looks for it, and it remembers what it learned for next time.
3.1 Building the GP Schema Map
The schema discovery process is the most labor-intensive step — and the one most worth automating. When Atlas encounters a new GP for the first time, it performs a structured document survey:
Identify all tables and their headers within the document
Locate candidate fields matching the firm's target extraction schema (NAV, MOIC, DPI, TVPI, RVPI, capital called, distributions, unfunded commitment, fair value by company)
Resolve label ambiguity — is "Total Partners' Capital" the NAV or the contributed capital? Atlas cross-references values against prior-period capital account statements if available
Record the mapping with confidence scores and flag any fields requiring human review
On subsequent quarters, schema retrieval reduces extraction time dramatically. For GPs with 3+ quarters in the memory layer, Atlas achieves extraction accuracy above 95% on key fields without any manual review of document structure.
3.2 Entity Resolution Across GPs
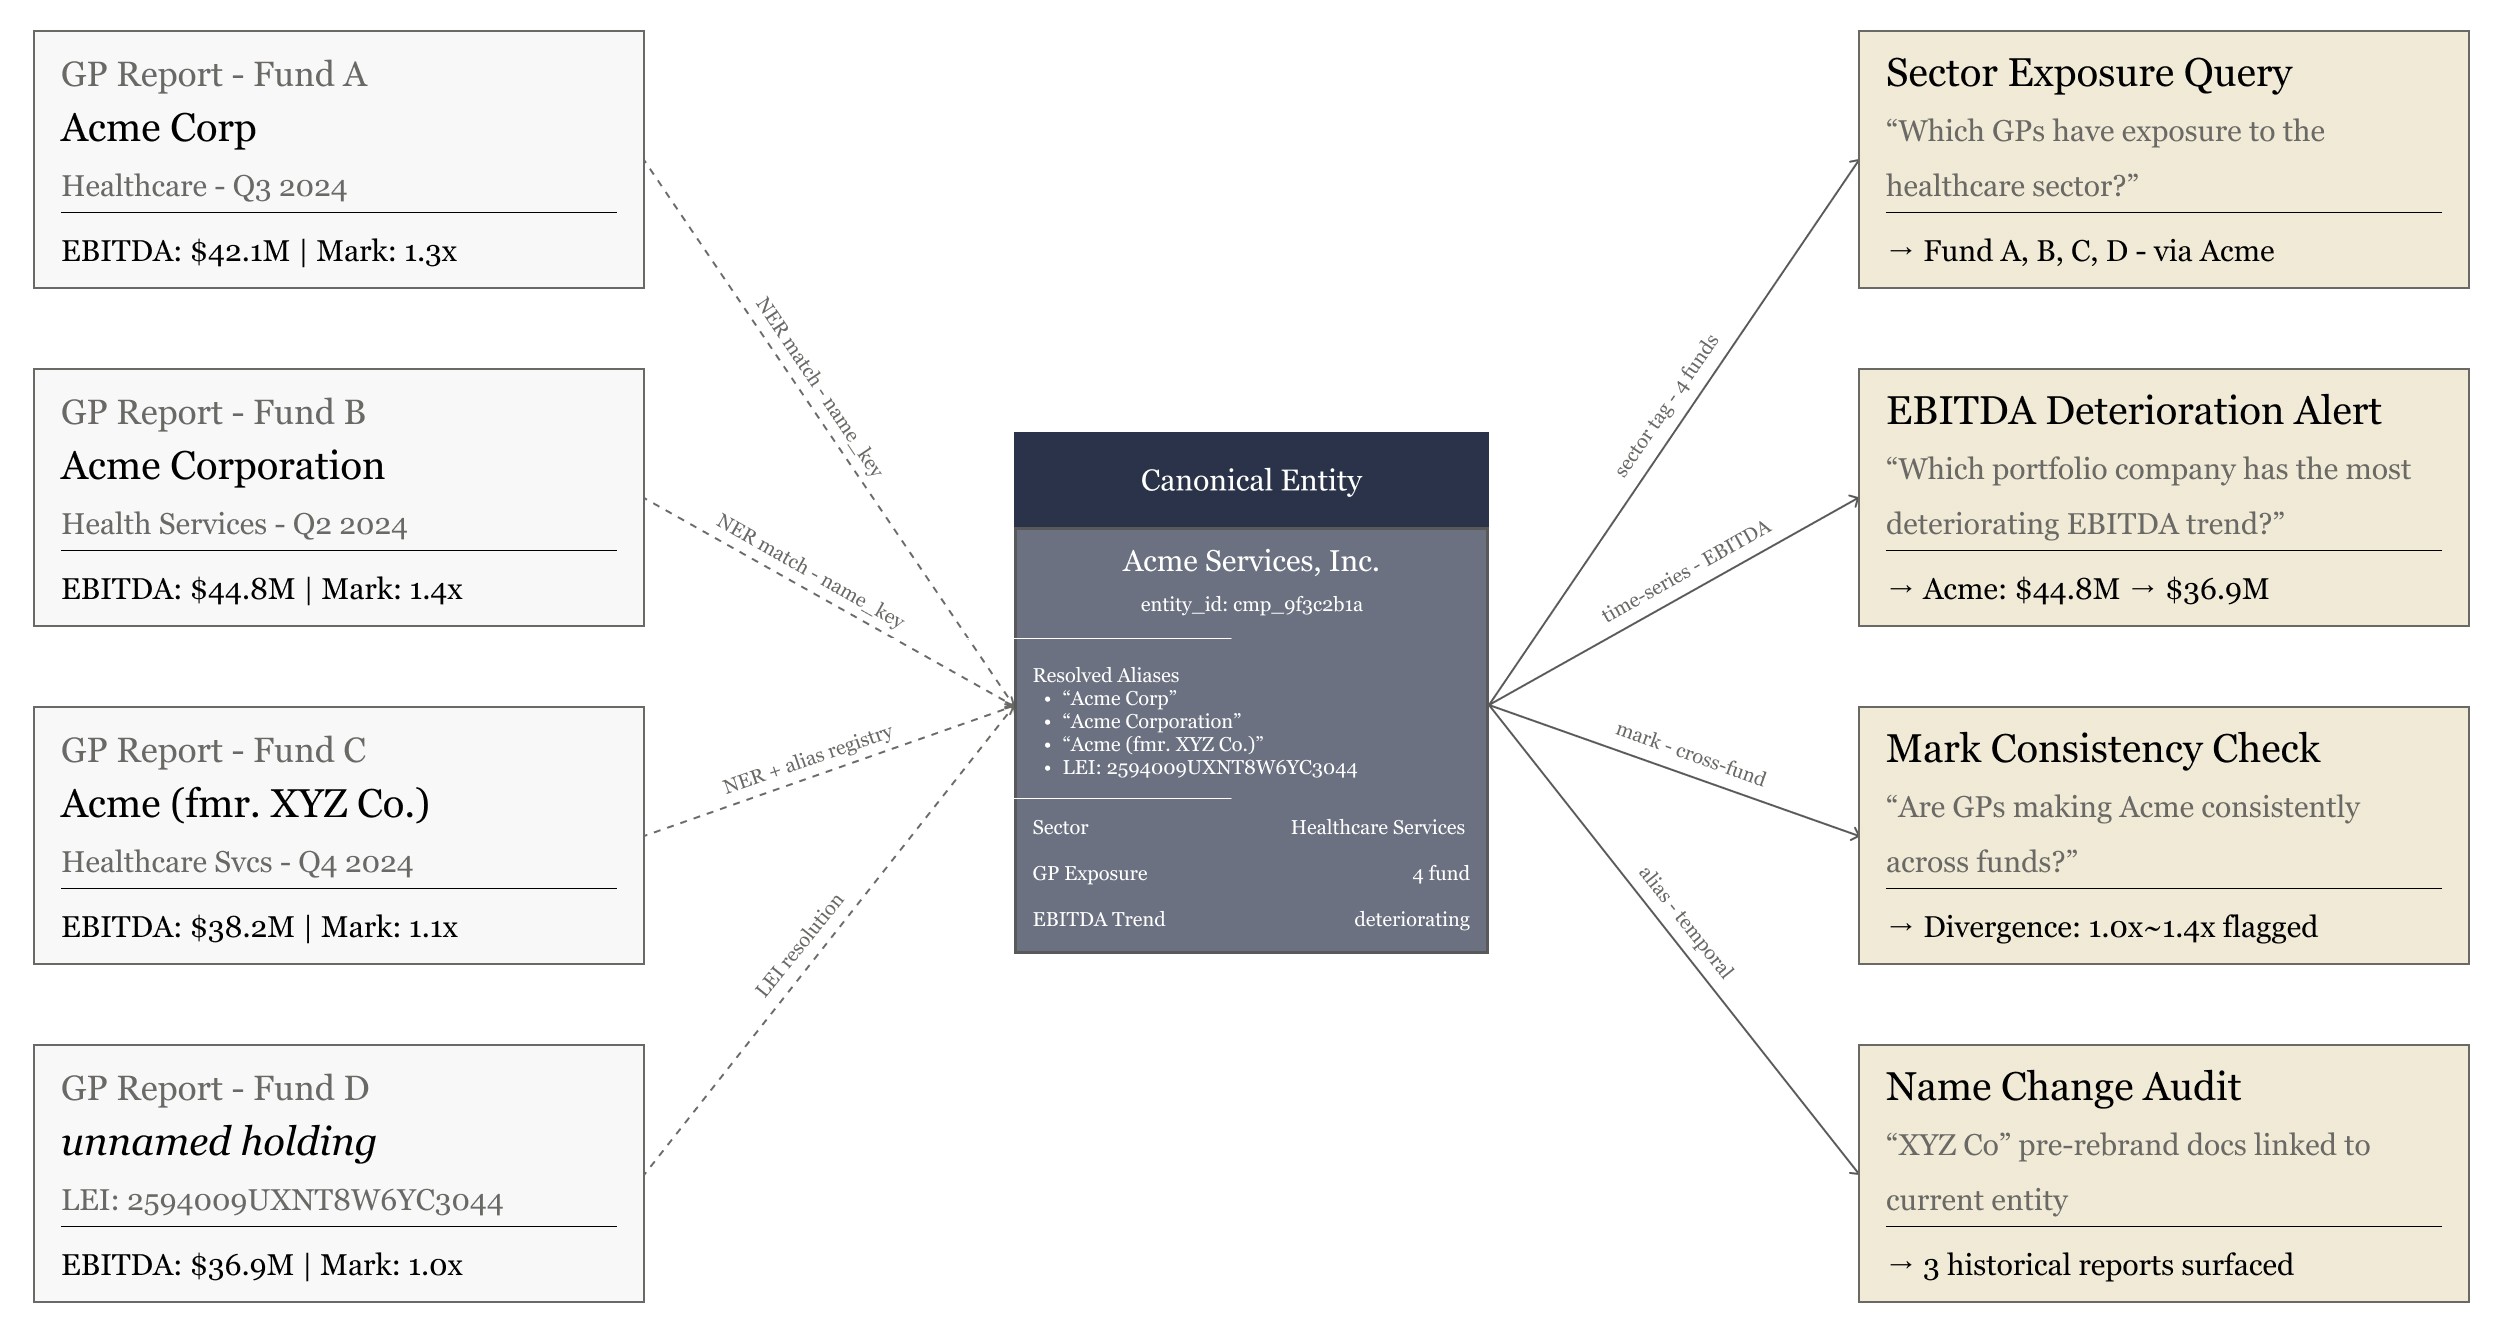
A subtler challenge in secondaries is entity resolution across the portfolio. The same portfolio company may appear under different names across GP reports: "Acme Corp," "Acme Corporation," "Acme (formerly XYZ)," or simply as a line item without a name but with a recognizable CUSIP or deal code.
Atlas maintains a cross-GP entity registry as part of the memory layer, using named entity recognition (NER) and entity resolution techniques to disambiguate references. This enables the firm to ask cross-portfolio questions — "which GPs have exposure to the healthcare sector?" or "across all quarterly reports, which portfolio company has the most deteriorating EBITDA trend?" — that would be impossible without a unified entity graph.
Lattice: The Excel Agent That Closes the Last Mile
Extraction accuracy means little if analysts must still manually paste values into fund models. The last mile — getting clean, normalized data from Atlas into a firm's existing Excel-based fund model — is where most AI tools break down entirely. Either they produce exports that require extensive reformatting, or they cannot interface with the specific structure of a firm's proprietary models at all.
Lattice is Clarus's Excel agent, designed to bridge this gap. Rather than requiring a firm to migrate to a new portfolio management system, Lattice works within the firm's existing Excel infrastructure.
4.1 Model Mapping: Learning the Fund Model's Schema
Just as Atlas builds a schema map for each GP's reporting style, Lattice builds a schema map for the firm's fund model. During the initial setup, Lattice analyzes the model's structure:
Which tabs contain which data (fund-level summary, LP capital account, portfolio company roll-up, cash flow waterfall)
What the input cells are and how they're labeled (sometimes cryptically, as in legacy models built over many years)
What formulas and cross-references depend on those input cells — so Lattice knows the downstream impact of each data point it writes
What the expected data types, units, and sign conventions are for each field
This model map is stored in the memory layer alongside the GP schema maps. The result is a fully bidirectional knowledge base: Atlas knows how each GP reports, and Lattice knows where each field lives in the fund model.
4.2 Normalized Input: From GP Format to Model Format
The normalization step — translating from GP-specific reporting conventions to the fund model's expected schema — is handled by a dedicated normalization layer that sits between Atlas and Lattice. This layer applies the transformation rules stored in the memory layer:
GP Reporting Convention | Raw Extracted Value | Normalization Applied | Model Input Value |
|---|---|---|---|
NAV labeled 'Partners' Capital' in EUR | €142.3M | Convert EUR→USD at quarter-end FX; relabel to 'NAV (USD)' | $154.7M |
Distributions reported as negative (cash-out convention) | -$8.2M | Invert sign; fund model expects positive distributions | $8.2M |
MOIC calculated gross of fees by GP | 2.3x (gross) | Flag as gross; apply net-of-fees haircut from fund docs (1.8% annual mgmt fee) | 2.1x (net, est.) |
Capital called reported YTD, not quarterly incremental | $43.1M (YTD) | Subtract prior quarter YTD to derive Q3 incremental call | $6.4M (Q3) |
Every normalization decision is logged with its source rule and confidence level. If a normalization rule is applied for the first time (e.g., a new FX convention), it is flagged for human review before being committed to the memory layer. This ensures the system cannot silently propagate errors.
4.3 Automated Model Population With Full Audit Trail
Once normalized values are validated, Lattice writes them directly to the fund model's input cells. Each write operation is logged with:
Source document (GP quarterly report, filename, date)
Exact location in source document (page, table, row, column)
Normalization rules applied and their version
Confidence score and any flags requiring review
Timestamp and operator (Lattice agent ID)
This audit trail satisfies the institutional requirement for data provenance — a critical consideration for firms subject to regulatory oversight or LP reporting obligations. An analyst can click any cell in the fund model and trace it back to the exact sentence in the exact GP report from which it originated.
The Compounding Advantage: Why the System Gets Better Over Time
The most important property of the memory layer architecture is that it compounds. Unlike a generic AI tool that approaches every document as a blank slate, Clarus's system grows more accurate and more efficient with every quarter of data it processes.
Phase | What the System Has Learned | Opera |
|---|---|---|
After Q1 (initial ingestion) | GP schema maps for 40–60 funds; entity registry initialized; normalization rules established | Extraction requires moderate human review; typical cycle time reduced from 5 days to ~2 days |
After Q3~Q4 | Reconciliation anchors validated; exception cases catalogued; FX and sign conventions confirmed | Human review limited to flagged exceptions only; cycle time ~4–6 hours |
After Year 2+ | Multi-year trend baselines; cross-GP portfolio company exposure mapping; vintage-level benchmarking | Near-automated quarterly cycle; analyst focus shifts to analysis rather than data assembly |
The strategic implication is that a Clarus deployment is not a static tool purchase — it is an investment in a proprietary data infrastructure that becomes increasingly difficult for competitors to replicate. The memory layer, built from a firm's own historical documents and institutional knowledge, constitutes a genuine moat.
What This Looks Like in Practice A Illustrative Walkthrough
The following describes how we deployed Atlas and Lattice for a secondaries fund manager managing LP positions across 55 GPs — a diversified portfolio spanning buyout, growth equity, and venture funds across multiple vintages and geographies.
Before Clarus: The Quarterly Cycle
Each quarter, the team's process looked like this. As GP reports filed — typically over the course of two to three weeks following quarter-end — analysts downloaded them from the LP portal and worked through them sequentially. For each fund, an analyst manually located the relevant performance figures: NAV, DPI, TVPI, RVPI, capital called, distributions, and unfunded commitment. Values were then transcribed into a master Excel tracker before being fed into the fund model, with the analyst also responsible for manually adjusting for currency, sign conventions, and gross/net distinctions that varied by GP.
The total cycle ran 4 to 6 hours of focused analyst time per fund model update — not counting the back-and-forth required to resolve ambiguous labels or flag discrepancies. Across a 55-GP portfolio, that translated to several days of work before any analysis could begin. Transcription errors were a recurring problem, caught most often during IC prep when inconsistencies surfaced under scrutiny.
After Clarus: The Same Quarter, Two Quarters In
By the second full quarter after deployment, the process had fundamentally changed. As GP reports arrived, Atlas ingested them automatically. For 48 of the 55 GPs — those with prior-quarter schema maps already stored in the memory layer — extraction proceeded without any analyst involvement. For the remaining 7 (new or infrequent reporters), Atlas ran schema discovery and surfaced a draft map for a brief review before committing.
The normalization layer applied currency conversions, sign inversions, and gross/net flags automatically, drawing on rules established and validated in prior quarters. Lattice then wrote the normalized values directly into the fund model, with each cell hyperlinked to its source page and table in the originating GP report.
What reached the analyst was a review queue: a short list of flagged exceptions — values that failed reconciliation checks against prior-quarter roll-forwards, or normalization rules applied for the first time. Reviewing that queue and signing off on the populated model took approximately 40 minutes.
A process that previously consumed the better part of a week came down to 40 minutes of human review — focused entirely on genuine exceptions, not routine transcription.
The fund model itself was unchanged. The GP reports were unchanged. The only difference was that the system now understood how each GP reported, remembered it, and handled the mapping automatically.
Why This Architecture Is Different From Generic AI Tools
A common question we hear from investment teams is whether existing AI tools — ChatGPT with file upload, Microsoft Copilot, or generic document AI platforms — can accomplish the same thing. They cannot, and the reasons are architectural rather than superficial.
Dimension | Generic AI Tool | Clarus (Atlas + Memory Layer) |
|---|---|---|
GP schema knowledge | Relearned from scratch each session | Persistent; accumulated across all prior quarters |
Normalization rules | Must be re-specified in every prompt | Stored in memory layer; applied automatically |
Model integration | None; outputs require manual reformatting | Direct write to firm's fund model via Lattice |
Audit trail | None; no provenance on extracted values | Full source traceability to page, table, row |
Accuracy over time | Flat; no improvement from prior documents | Compounding; improves with each quarter processed |
GP reporting edge cases | Handled inconsistently or missed | Catalogued in memory; handled consistently |
Closing Note
The secondaries market is, at its core, an information arbitrage business. Investors who can more quickly, accurately, and comprehensively synthesize fund-level data across a large and heterogeneous portfolio are better positioned to price risk, identify opportunity, and act decisively.
The operational bottleneck has never been data availability — GPs are required to report it. The bottleneck is the infrastructure to ingest, normalize, and synthesize that data at scale without consuming weeks of analyst capacity every quarter. The team we worked with knew this. What changed was having a system that remembered the work it had already done.
Clarus did not ask them to change their fund model, retrain their analysts, or migrate to a new platform. We built on top of the GP reports they already received and the Excel models they already used — and the system compounded from there. By quarter two, the quarterly data assembly cycle that once took a week of analyst hours was resolved in a single 40-minute review session.
If your quarterly data assembly cycle still looks like the one we described above, we would welcome the opportunity to walk through this with your actual documents — no generic demo, just your GPs and your model.